
Logs are like your website's diary - they record everything that happens, good and bad. Learning to read them is like gaining superpowers for troubleshooting!
Your hosting account generates several types of logs:
| Log Type | What It Records | Location |
|---|---|---|
| Access Log | Every visitor request | /logs/access.log |
| Error Log | Server and PHP errors | /logs/error.log |
| PHP Error Log | PHP-specific errors | /logs/php_error.log |
| Mail Log | Email sending activity | /logs/mail.log |
| FTP Log | FTP/SFTP connections | /logs/ftp.log |
| Cron Log | Scheduled task output | /logs/cron.log |
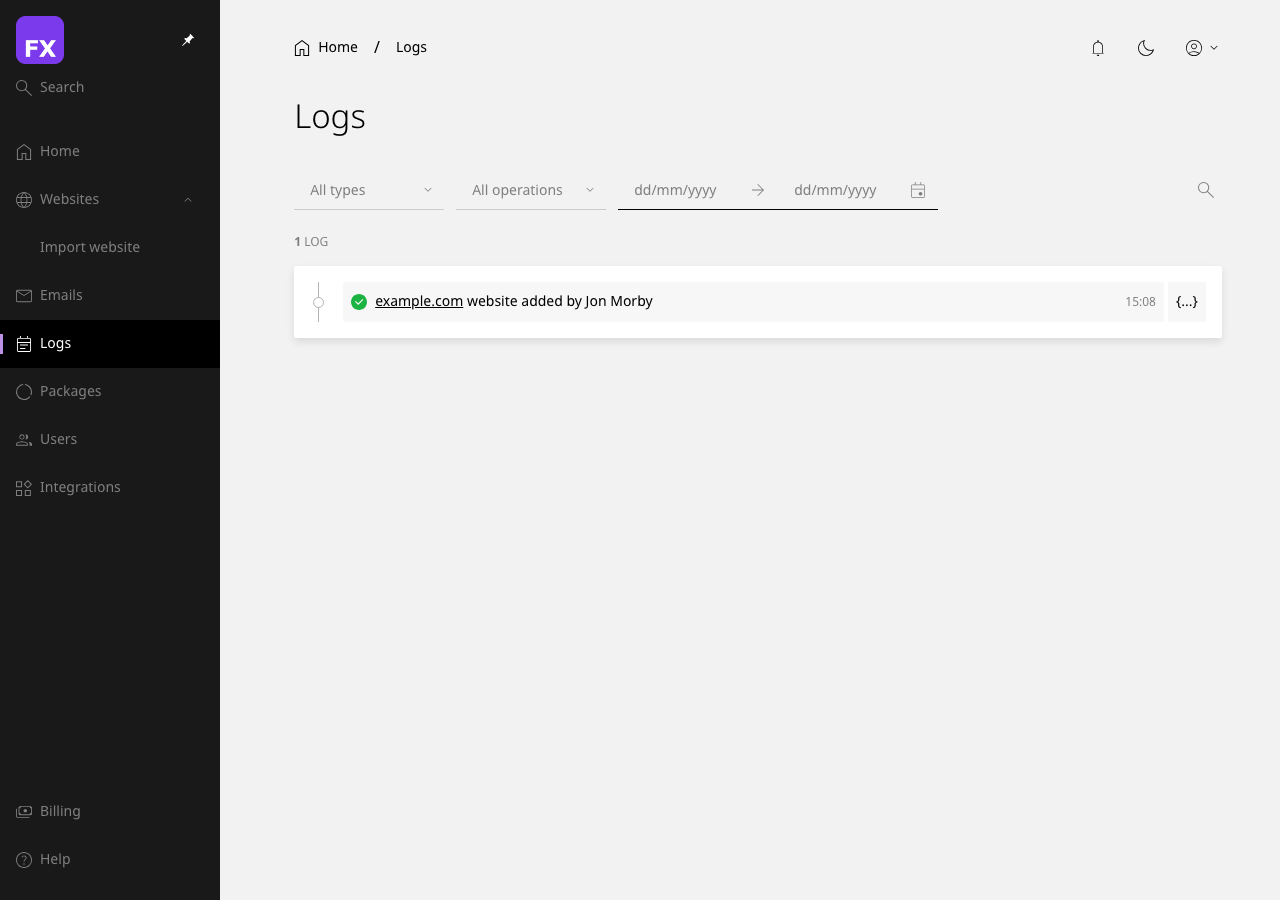
logs directory# View last 100 lines of error log
tail -100 ~/logs/error.log
# Watch error log in real-time
tail -f ~/logs/error.log
# Search for specific errors
grep "Fatal error" ~/logs/error.log
# View access log
tail -100 ~/logs/access.logAccess logs record every HTTP request to your website.
192.168.1.1 - - [27/Jan/2025:10:15:30 +0000] "GET /page.html HTTP/1.1" 200 5234 "https://google.com" "Mozilla/5.0..."| Part | Meaning | Example |
|---|---|---|
| IP Address | Visitor's IP | 192.168.1.1 |
| Date/Time | When request occurred | 27/Jan/2025:10:15:30 |
| Request | Method and URL | GET /page.html |
| Status Code | Response status | 200 (success) |
| Size | Bytes sent | 5234 |
| Referrer | Where they came from | https://google.com |
| User Agent | Browser/bot info | Mozilla/5.0... |
| Code | Meaning | Action Needed |
|---|---|---|
| 200 | OK | None - all good! |
| 301 | Permanent redirect | Check if intentional |
| 302 | Temporary redirect | Check if intentional |
| 304 | Not modified (cached) | Good for performance |
| 400 | Bad request | Check for malformed URLs |
| 401 | Unauthorized | Login required |
| 403 | Forbidden | Permission issue |
| 404 | Not found | Fix broken links |
| 500 | Server error | Check error logs! |
| 502 | Bad gateway | Backend issue |
| 503 | Service unavailable | Server overloaded |
| 504 | Gateway timeout | Backend too slow |
Find most requested pages:
awk '{print $7}' access.log | sort | uniq -c | sort -rn | head -20Find IPs making most requests:
awk '{print $1}' access.log | sort | uniq -c | sort -rn | head -20Find 404 errors:
grep '" 404 ' access.log | awk '{print $7}' | sort | uniq -c | sort -rnFind potential attacks:
grep -E "(wp-login|xmlrpc|admin)" access.log | awk '{print $1}' | sort | uniq -c | sort -rn[SCREENSHOT: Terminal showing access log analysis commands and output]
Error logs are your best friend when things go wrong.
| Type | Severity | Example |
|---|---|---|
| Fatal Error | Critical - script stops | Missing required file |
| Parse Error | Critical - syntax issue | Missing semicolon |
| Warning | Important but continues | Deprecated function |
| Notice | Minor issue | Undefined variable |
| Deprecated | Future compatibility | Old function usage |
Fatal Error:
[27-Jan-2025 10:15:30 UTC] PHP Fatal error: Uncaught Error: Call to undefined function mysql_connect() in /home/user/public_html/config.php:15Warning:
[27-Jan-2025 10:16:45 UTC] PHP Warning: Division by zero in /home/user/public_html/calculate.php:23Parse Error:
[27-Jan-2025 10:17:00 UTC] PHP Parse error: syntax error, unexpected '}' in /home/user/public_html/functions.php:156Every error tells you:
[27-Jan-2025 10:15:30 UTC] PHP Fatal error: Allowed memory size of 268435456 bytes exhausted in /home/user/public_html/wp-includes/class-wp-query.php on line 2456Find all fatal errors:
grep "Fatal error" ~/logs/error.logFind errors from today:
grep "27-Jan-2025" ~/logs/error.logFind errors in specific file:
grep "my-plugin.php" ~/logs/error.logCount errors by type:
grep -oE "(Fatal error|Warning|Notice|Deprecated)" ~/logs/error.log | sort | uniq -c[SCREENSHOT: Error log viewer showing various error types with timestamps]
Add to wp-config.php:
// Enable debugging
define('WP_DEBUG', true);

// Log errors instead of displaying
define('WP_DEBUG_LOG', true);
define('WP_DEBUG_DISPLAY', false);

// Log database queries (use sparingly - generates large logs!)
define('SAVEQUERIES', true);
Debug log location: /wp-content/debug.log
# View recent WordPress errors
tail -100 ~/public_html/wp-content/debug.log

# Find plugin errors
grep "plugins" ~/public_html/wp-content/debug.log

# Find database errors
grep -i "database\|mysql\|query" ~/public_html/wp-content/debug.logJan 27 10:15:30 server postfix/smtp[12345]: ABC123: to=<user@example.com>, relay=mail.example.com[192.168.1.1]:25, status=sent (250 OK)"Relay access denied"
"Connection refused"
"Mailbox full"
Logs can grow enormous if left unchecked. Enhance typically handles rotation automatically:
.gz)# List all error logs including rotated
ls -la ~/logs/error.log*
# View compressed log
zcat ~/logs/error.log.1.gz
# Search in compressed logs
zgrep "Fatal error" ~/logs/error.log.*.gzVia SSH:
# Watch error log in real-time
tail -f ~/logs/error.log

# Watch multiple logs
tail -f ~/logs/error.log ~/logs/access.log

# Watch with highlighting (if `ccze` is available)
tail -f ~/logs/error.log | ccze
Via Enhance Dashboard:
[SCREENSHOT: Real-time log viewer with live entries appearing]
Look in error logs for:
PHP Fatal error: ...
Segmentation fault
Out of memoryCheck access logs for:
Warning signs in logs:
# Suspicious file access
GET /wp-content/uploads/evil.php
POST /xmlrpc.php (many requests)
GET /wp-admin/ from unusual IPs

# Encoded/obfuscated requests
eval(base64_decode...
\x encoded stringsCheck mail logs for:
status=bounced
status=deferred
relay access denied
connection refusedUpload your logs (anonymised if needed) to:
# Generate HTML report
goaccess ~/logs/access.log -o report.html --log-format=COMBINED

# Real-time terminal view
goaccess ~/logs/access.log --log-format=COMBINED
[SCREENSHOT: GoAccess report showing visitor statistics and top pages]
Next Steps: Managing domains? Check out our Domain Management Guide.